Introduction
Leadership development is a central goal for colleges and universities given the importance of co-curricular participation to college student outcomes (Astin & Astin, 2000; Morse, 1989). Recently involvement has been shown to be positively related to student leadership capacity (Astin & Astin, 2000; Dugan & Komives, 2007). Dugan and Komives (2007) suggest that “increases in leadership development in turn enhance the self-efficacy, civic engagement, character development, academic performance, and personal development of students” (p. 8).
Dugan and Komives (2007) noted several trends in higher education that support a renewed focus on developing critical leadership skills among students and call “for institutions of higher education to purposefully develop socially responsible leaders” (p. 5). The social change model of leadership (SCM) which involves the growth of critical values in three domains ( individual, group, and societal), emphasizes social responsibility and approaches leadership as a values-based, purposeful process resulting in positive social change (Komives, Dugan, Owen, Slack, Wagner, & Associates, 2011). Individual values of the SCM include consciousness of self, congruence, and commitment (see Table 1), and require students to increase their level of self-knowledge, act in ways that are consistent with their personal values, and significantly invest in serving the group and its goals (Komives et al., 2011). Likewise, strengths-based development, which is grounded in positive psychology, involves three stages at the individual level: the identification of talent, integration into how one views himself or herself, and behavioral change (Clifton & Harter, 2003). Due to these conceptual similarities, leadership educators should consider the use of a strengths-development model (e.g., StrengthsQuest) in the development of the individual values of the SCM. Furthermore, there is evidence that strengths-based developmental interventions can increase levels of hope (Hodges & Clifton, 2004). Therefore, hope should also be examined to individual values of consciousness of self, congruence, and commitment.
The problem is that to date no studies have examined the relationship of hope and strengths-based development models to individual values of the SCM. Thus, the purpose of this study is to examine the relationship between one’s beliefs in their individual talents (i.e., strengths self-efficacy) as identified by a strengths-based development model (Zhao, Tsai, Chaichanasakul, Flores, & Lopez, 2010) and hope (Snyder, 1995) to the individual values of the SCM on the SLRS revised scale (Tyree, 1998). These constructs along with student engagement (Harter, Schmidt, Killham, & Agawam, 2009), gender and race (Dugan et al., 2008; Dugan & Komives, 2007), and community service (Dugan, 2006b; Dugan, Bohle, Gebhardt, Hofert, Wilk, & Cooney, 2011; Dugan & Komives, 2007; Dugan & Komives, 2010; Haber & Komives, 2009) will be examined. The results and their implications for theory and practice will be discussed.
Table 1
SCM Individual Values and Definitions
|
Value |
Definition |
|
Consciousness of Self |
Awareness of the beliefs, values, attitudes, and emotions that motivate one to take action. |
|
Congruence |
Thinking, feeling, and behaving with consistency, genuineness, authenticity, and honesty towards others; actions are consistent with most deeply-held beliefs and convictions. |
|
Commitment |
The psychic energy that motivates the individual to serve and that drives the collective effort; implies passion, intensity, and duration, and is directed toward both the group activity as well as its intended outcomes. |
Source: HERI, 1996
Literature Review
The Social Change Model of Leadership
The social change model of leadership (Higher Education Research Institute [HERI ], 1996) was created “to enhance the development of leadership qualities in all participants – those who hold formal leadership positions as well as those who do not – and to promote a process that is inclusive and actively engages all who wish to contribute” (p. 18). Today the SCM is the most widely used leadership model within student development programs across colleges and universities (Kezar et al., 2006; Komives et al., 2011; Komives & Wagner, 2009).
Figure 1. The Social Change Model of Leadership
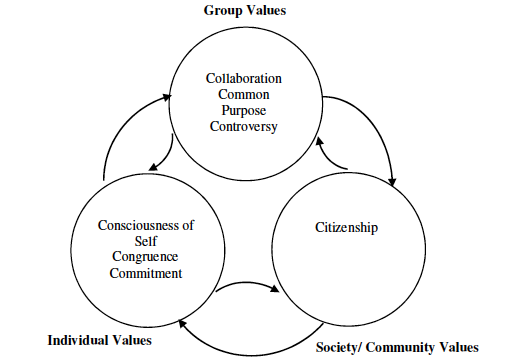
Source: Adapted from A social change model of leadership development (3rd ed., p. 20) by Higher Education Research Institute [HERI]. Copyright © 1996, National Clearinghouse for Leadership Programs. Reprinted with permission of the National Clearinghouse for Leadership Programs.
The SCM includes several core values considered to be “critical elements” of the model (Figure 1) (HERI, 1996, p. 20). Change is the value “hub” in which the model is framed and is “the ultimate goal of the creative process of leadership” (HERI, 1996, p. 21). Change gives purpose to the other values described as the 7 Cs (HERI, 1996; Komives & Wagner, 2009). These values function at the individual, group, and societal levels and are used as a tool to enhance students’ level of self-awareness and ability to work with others (Dugan, 2006a). The individual values include consciousness of self, congruence, and commitment which examine personal qualities that are most supportive of group functioning and positive social change (HERI, 1996). Group values consist of common purpose, controversy with civility, and collaboration which examine ways in which the collaborative process facilitates the development of individual qualities that effect positive social change (HERI, 1996). Lastly, the society/community value is citizenship which explores the social ends of leadership development and service activities that promote group collaboration and develop individual character (HERI, 1996).
In 2006, the Multi-Institutional Study of Leadership (MSL) was created in part to inform our understanding of the SCM and has collected data from participants across the country (Multi-Institutional Study of Leadership, 2011). Published findings from MSL data suggest students involved in community service and leadership programs are more likely to score higher on one or more dimensions of the SCM as measured by the socially responsible leadership scale (Dugan et al., 2011; Dugan & Komives, 2007; Dugan & Komives, 2010; Haber & Komives, 2009). In addition to engagement, certain demographic factors were also found to be significant. A study by Dugan, Komives, and Segar (2008) found that African American/Black students reported significantly higher mean scores than White students on consciousness of self. Asian Americans scored significantly lower than peers from all racial categories across consciousness of self and significantly lower than peers in all categories except Native Americans on congruence and commitment. Literature also reveals that women score statistically higher than men on all SCM scales except for change (Dugan et al., 2008; Dugan & Komives, 2007). However, there is still a lack of understanding of these outcomes in relation to commonly used concepts in positive psychology. Therefore, additional research is needed to improve our understanding of the relationship between the SCM and other constructs within the literature.
StrengthsQuest & Strengths Self-Efficacy
One construct that may help to inform our understanding of the individual values of the SCM is one’s beliefs in one’s individual talents (strengths self-efficacy) identified through the use of strength-based educational models. “Strengths-based approaches related to seeking new experiences and applying effort is most apparent when considered within the context of research which suggests that students’ implicit self-theories, or beliefs about the degree to which their personal abilities are malleable, exert profound effects on behavior within educational environments” (Lopez & Louis, 2009, p. 6). Development within this model requires that individuals identify things done at excellence, claim them as strengths, and share them with others. Individuals must consciously think about ways in which performance can be maximized when behaviors and talents are aligned, apply necessary knowledge and skills, and actively use their talents (Hodges & Clifton, 2004).
StrengthsQuest is an educational model designed to provide students with the knowledge and awareness of their individual talents, promote individual growth, and has been used by more than 600 campuses and 850,000 students in North America (The Gallup Corporation, 2011). Clifton, Anderson, and Schreiner (2006a) suggest several things happen when individuals become more aware of their talents through the use of this inventory. First, there is an increased understanding of others through the use of a common language. Second, this common language leads to increased interpersonal closeness, cooperation, and a greater sensitivity to social barriers. From an individual perspective, an awareness of individual talents brings about greater self-confidence and a sense of identity and direction (Clifton, Anderson, & Schreiner, 2006b).
However, StrengthsQuest is an educational tool that provides only one’s identified talents and does not directly measure the belief in those talents. As such, Zhao, Tsai, Chaichanasakul, Flores and Lopez (2010) developed a strengths self-efficacy scale to assess individuals’ perceived self-efficacy in the utilization of their personal strengths. A person’s “strength” is the ability to provide consistent, near-perfect performance in a specific task using a set of individual talents (Hodges & Clifton, 2004). As such, strengths self-efficacy is defined as an awareness and belief in one’s individual talents and is grounded in positive psychology (Zhao et al., 2010). Literature on the broader construct of self-efficacy suggests this improves in task performance and persistence and has the potential to assist people in addressing psychological, physical, and social challenges more effectively and with more confidence (Bandura, 1997; Hagedoorn & Molleman, 2006). Therefore, Zhao et al., (2010) suggest devising plan to gain control of and implement one’s strengths across different roles and situations.
Hope Theory
Recent literature offers evidence that strengths-based developmental interventions, such as the use of StrengthsQuest, can increase levels of hope (Hodges & Clifton, 2004). Helland and Winston (2005) define hope as “an activating force that enables people, even when faced with the most overwhelming obstacles, to envision a promising future and to set and pursue goals” (p.43). In higher education, hope predicts resilience (Worrell & Hale, 2001), academic success (Snyder, 2002), and persistence (Snyder, 2002). Within positive psychology, hope is positively correlated with self-esteem, optimism, and positive affect (Snyder, 2002) which are related to citizenship behavior, performance, and authentic leadership (Walumbwa, Luthans, Avey, & Oke, 2011). As such, this may suggest individual values of the SCM are also related to hope.
While the concept of hope would seem to have a critical place in the study of leadership, little attention has been paid to hope within leadership studies (Helland & Winston, 2005). However, those who have explored hope within leadership value its inclusion as an integral part of leadership development (Cerff, 2006; Goethals, Sorenson, & Burns, 2004; Shorey & Snyder, 2004). Bennis (1999) and Rath and Conchie (2009) define hope as one of four provisions by exemplary leaders that will satisfy followers’ needs and contribute to achieving positive outcomes. Literature also identifies hope as a core construct in authentic leadership (Luthans & Avolio, 2003; Avolio, Gardner, Walumbwa, Luthans, & May, 2004) which encourages leaders to be more positive, build on strengths, expand their horizon of thinking, and act ethically and morally. According to Helland and Winston (2005), hope, like leadership, arises in a relationship with others and that those with high hope are more likely to discuss the outcomes and action needed to attain those goals with others. While research is limited, the development of hopeful thinking in leaders and designing leadership programs that enhance hopeful thinking in students is suggested (Helland & Winston, 2005).
Research Questions
Given the literature on strengths-based educational models and hope in leadership, this study seeks to test the relationship of strengths self-efficacy and hope to the individual values of the social change model of leadership (consciousness of self, congruence, commitment). Furthermore, the relationship of previously identified variables from the SCM literature will be examined. The following research questions guided this study:
- Q1: What is the relationship of strengths self-efficacy and hope to the individual values of the SCM?
- Q2: Are previously identified predictor of student engagement, gender, race, and community service related to the individual values of the SCM in this independent sample?
Methodology
Sample
Data (n=157) was collected from undergraduate students attending a private mid- size urban institution in the southwest. Students at this university are primarily traditional age (M=19.52, SD=1.27) and 46% live on-campus. Approximately 69% (n=96) were women, which was slightly above the university demographic where women constitute 59% of the undergraduate student population.
Approximately, 75% of the sample were White/Caucasian, 8.6% Asian American, 9.4% Latino/a, 3% African American, and 4% other. Students in this study were also generally high achieving in terms of GPA (M=3.48, SD= 402), engaged in campus as indicated by Gallup’s college student engagement questionnaire defined below (M=7.35, SD=5.841), and participated in an average of 8 hours of community service per month (SD=5.42).
Procedure
Students enrolled in 10-week co-curricular leadership seminars, having previously taken the Clifton StrengthsFinder inventory, were invited to respond to a questionnaire during the spring 2010 and 2011 semesters. Students were informed that participation was voluntary and that their responses would be kept confidential. No compensation or incentives were provided for participation in the study.
Instruments
The questionnaire contained four instruments with relevant demographic questions based on the literature including gender, community service, and race. The entire questionnaire, excluding the Clifton StrengthsFinder inventory, contained 130 items.
Socially Responsible Leadership Scale (SRLS-R2). The individual values of the SCM were measured using the consciousness of self (nine items), congruence (seven items), and commitment (six items) scales from the Socially Responsible Leadership Scale-Revised Version 2 (Tyree, 1998). This entire instrument contains 68-item s rated on a 5-point scale (1=strongly disagree, 5=strongly agree) and measures the eight critical values of the social change model of leadership development (Dugan, 2006a). The SLRS-R2 serves as the primary framework for the multi-institutional study of leadership (MSL) and has been distributed to over 60,000 participants across 52 institutions. Questions for the SRLS-R2 include items such as “I could describe my personality.” Internal consistency estimates (ÿ) for these scales are reported on this scale range between .78 and .83 (Dugan, 2006a).
Strength’s Self-Efficacy Scale (SSES). Strengths self-efficacy was measured using the Strengths Self-Efficacy Scale containing 16 item s rated on a 10-point scale (1=not confident to 10=very confident). Strengths self-efficacy is defined as individual’s beliefs in their capability to apply personal strengths in their daily lives in order to maximize one’s potential (Zhao et al., 2010). Questions of the SSE scale include statements such as “I am confident in my ability to identify a strength needed to accomplish a task.” Internal consistency estimates (ÿ) have been reported to be .97 in the literature.
Adult Trait Hope Scale (ATH). Hope was measured using the Adult Trait Hope Scale (Snyder et. al., 1991) and contains 12 items on an 8 point scale (1=definitely false to 8=definitely true). Hope in this scale is defined as “a positive motivational state that is based on an interactively derived sense of successful (a) agency (goal-directed energy), and (b) pathways (planning to meet goals)” (Snyder et. al., 1991, p. 287). Questions of the ATH scale include items such as “I energetically pursue my goals.” Internal consistency estimates (ÿ) are reported in the literature to range between .74 – .84 (Rand & Cheavens, 2009).
College Student Engagement Scale (CSES). Student engagement was measured using the College Student Engagement Scale (Harter, Schmidt, Killham, & Agawam, 2009) and is conceptually similar to an abbreviated version of the National Survey of Student Engagement. This instrument contains 12 items on a 5-point scale (1=strongly disagree to 5=strongly agree) and measures attitudinal outcomes and engagement among college students (Harter, Schmidt, Killham, & Agawam, 2009). Engagement is this scale is defined as “the involvement in and enthusiasm for school” (Lopez, 2009, p. 1). Questions on the CSES include items such as, “at this school, I have the opportunity to do what I do best everyday.” Internal consistency estimates (ÿ) for the CSES has been reported to be .87 in the literature (Cantwell, 2005).
Data Analysis
Data in the study were analyzed using SPSS v.18.0. Internal consistency coefficients were calculated for each instrument using Cronbach’s Alpha prior to any statistical analyses. A canonical correlation analysis (CCA) was then performed to explore the relationship between independent and dependent variables. CCA was chosen because it can be superior to univariate methods (e.g., ANOVA, multiple regression) when dependent variables are theoretically related and reduces the likelihood of experiment wise error (Henson, 2000; Kimble, 2001; Sherry & Henson, 2005). Independent variables were specified as CSES, ATH, SSE, Gender, Race, and the average number of community service hours per week. Dependent variables were specified as consciousness of self, congruence, and commitment.
Assumptions of linearity and normality were examined using methods described by Henson (1999) and were within acceptable ranges. Missing data were replaced through an expectation-maximization (EM) algorithm which estimates missing values based on observed scores for participants in the sample. The full CCA model and individual functions were then evaluated using methods described by Sherry and Henson (2005). Both p values and effect sizes were considered in the interpretation of the model (Vacha-Haase & Thompson, 2004; Wilkinson & APA Task Force on Statistical Inference, 1999). Specifically, 1-Wilks’s ÿ was used as an effect size because it “can be interpreted just like the multiple R2 in regression as the proportion of variance shared between the variable sets across all functions” (Sherry & Henson, 2005, p. 42). Finally, the relative importance of variables within each function were assessed using both standardized canonical coefficients (weights) and structure coefficients (Pearson r between an observed variable and the canonical function scores) given their purported value in the literature (Courville & Thompson, 2001; Henson, 2002).
Results
A total of 250 questionnaires were distributed and 171 were returned for a response rate of 68.4%. Fourteen of these cases were removed due to substantial missing data. Two cases were found to impact univariate and multivariate skewness and were also removed. The final data set resulted in a sample of N=155 and descriptive statistics for continuous variables reported below (see Table 2).
Canonical variate score plots indicated no evidence of heteroscadiscity. Sample size was also considered using guidelines by Tabachnick and Fidell (2007) which suggests a participant to variable ratio of 10:1 for multivariate analyses when instrument reliability is around .80. The sample in this study employed a ratio approximately 17:1 with internal consistency estimates within the data between .78 – .96 (see Table 2).
Table 2
Descriptive Statistics of Continuously Scaled Variables (N=155)
|
Variable |
Descriptions |
M |
SD |
Skew |
Kurt |
ÿ |
|
Independent |
||||||
|
ComServ |
Community Service |
8.00 |
5.42 |
1.49 |
3.01 |
— |
|
CSES |
Hrs/Week Student Engagement Scale |
42.86 |
4.72 |
-.26 |
-.27 |
.80 |
|
ATH |
Adult Trait Hope |
26.02 |
3.24 |
-1.43 |
4.37 |
.85 |
|
SSES Dependent |
Strengths Self-Efficacy Scale |
117.45 |
20.65 |
-.29 |
-.34 |
.96 |
|
CoS |
Consciousness of Self |
4.07 |
.53 |
-.48 |
.24 |
.78 |
|
Congruence |
Congruence |
4.41 |
.49 |
-.93 |
1.52 |
.84 |
|
Commitment |
Commitment |
4.56 |
.41 |
-.95 |
.59 |
.79 |
A test of the statistical significance for the collective CCA model across all functions was examined first and found to be statistically significant F(18,373)=12.227, p>.001 (see Table 3). Within this collective model, approximately 73% of the variance was shared (=1 – .269 [Wilks’ ÿ]) across all variable sets (synthetic independent and dependent variables). This finding was larger than a previous study which reported shared variance estimates (R2) between 25-35% when univariately examining values of the SCM (Humphreys, 2007). This suggested that the proposed model as a whole was supported by the results and warranted further interpretation.
Table 3
Statistical Significance Tests for the Full CCA Model
![]()
Test Value Approximate F Hypothesis Error DF p
DF
|
Pillais’ |
.849 |
8.829 |
18 |
402 |
< .001 |
|
Hotelling’s |
2.276 |
16.565 |
18 |
392 |
< .001 |
|
Wilks’ |
.269 |
12.226 |
18 |
373 |
< .001 |
|
Roy’s |
.675 |
— |
— |
— |
< .001 |
Individual functions were then interpreted through a dimension reduction analysis which allows the researcher to hierarchically test functions for statistical significance. In this model, three functions were extracted with squared canonical correlations (of .6 75, .115, and .059) for each successive function (see Table 4). The first two canonical functions (functions 1 to 3 [full model]; functions 2 to 3) were found to be statistically significant, F (18,373) = 10.038, p < .001 and F (10,266) = 7.64, p=.006. However, only the first function (functions 1 to 3) was interpreted given it explained approximately 68% of variance in that function with the second explaining only 11% of the residual variance in the model. Standardized canonical coefficients (coef) and structure coefficients (rs) for all hierarchical functions are reported below (see Table 5).
Table 4
Canonical Correlations Dimension Reduction Analysis for All Functions
|
Canonical Correlations |
|||||
|
Roots |
Eigenvalues |
% |
Cumulative % |
Canonical Correlation |
Squared Correlation |
|
1 |
2.083 |
91.526 |
91.52 |
.822 |
.675 |
|
2 |
.129 |
5.689 |
97.21 |
.336 |
.115 |
|
3 |
.063 |
2.785 |
100.00 |
.244 |
.059 |
|
Dimension Reduction Analysis |
|||||
|
Roots |
Wilks’ ÿ |
F |
Hypothesis df |
Error df |
p |
|
1 to 3 |
.269 |
12.227 |
18 |
373 |
< .001 |
|
11 .833 2.553 |
10 |
266 |
.006 |
||
|
81 |
|||||
|
2 |
|||||
|
to |
|||||
|
3 |
|||||
|
3 to 3 .940 . 2.124 |
4 |
134 |
.081 |
||
Our next aim was to identify which independent variables best explained variability in the linear combination of the dependent variables (Consciousness of Self, Congruence, and Commitment) in function 1 to 3. Results suggest strengths self-efficacy (coef=-.552), adult trait hope (coef=-.400), and student engagement (coef=-.356), were most salient in their contribution to the effect, with each of these three explaining approximately 47% – 71% of variance in the synthetic dependent variable (i.e., squared structure coefficients). This was considerably larger than race, gender and community service which each explain less than 5% of the synthetic dependent variable. Strengths self-efficacy, adult trait hope, and student engagement were positively correlated to one another as indicated by the signs of variable structure coefficients. Each was also positively correlated to all dependent variables suggesting increased hope, self-efficacy, and student engagement correspond to higher scores of the individual values of the SCM. Near zero standardized weights (coefs<ÿ.086ÿ) and structure coefficients (r s < ÿ.209ÿ) for gender, race, and community service hours suggested these variables were not correlated to the individual values of the SCM within the data.
Table 5
Canonical Solution for Independent and Dependent Variables
![]()
![]()
Function1 to 3 Function 2 to 3 Function 3
|
Variables |
Coef |
rs |
2 r s |
Coef |
rs |
2 r s |
Coef |
rs |
2 r s |
||
|
Dependent |
|||||||||||
|
CoS |
-.727 |
-.956 |
.914 |
.536 |
.224 |
.050 |
.972 |
.190 |
.036 |
||
|
Congruence |
-.022 |
-.759 |
.576 |
1.036 |
.128 |
.016 |
-1.332 |
-.639 |
.408 |
||
|
Commitment |
-.354 |
-.812 |
.659 |
-1.600 |
-.467 |
.218 |
.101 |
-.350 |
.123 |
||
|
Independent |
|||||||||||
|
CECS |
-.356 |
-.686 |
.471 |
.332 |
.136 |
.018 |
-.166 |
.015 |
<.001 |
||
|
ATH |
-.400 |
-.801 |
.641 |
-.603 |
-.310 |
.096 |
-.698 |
-.303 |
.091 |
||
|
SSES |
-.522 |
-.846 |
.716 |
.563 |
.145 |
.021 |
.662 |
.271 |
.073 |
||
|
Gender |
.086 |
-.065 |
.004 |
-.080 |
-.072 |
.005 |
.477 |
.463 |
.214 |
||
|
Race |
.018 |
.209 |
.043 |
.759 |
.656 |
.430 |
-.576 |
-.547 |
.229 |
||
|
ComServ |
.012 |
-.113 |
.013 |
-.497 |
-.368 |
.135 |
-.336 |
-.226 |
.051 |
Note. Structure coefficients (rs) greater than |.45| are bolded. Coef = standardized canonical function coefficient; rs = structure coefficient; r s2 = squared structure coefficient or % shared variance between an observed variable and the canonical function score.
Lastly, the model was examined to identify which of the individual values of the SCM were explained by the independent variables. Standardized canonical coefficients indicated a large weight for consciousness of self (coef=-.727) and a near zero weight for congruence (coef = -.022). However, variable structure coefficients suggested at least half of the variability in consciousness of self (r s2 =.914), congruence (r s2=.576), and commitment (r s2 = .659) could be explained by the independent variables. Consciousness of self was best explained relative to the other two (i.e., 25% or more variability) but all three were considered relevant given their structure coefficients. All of the individual values were positively correlated with one another, strengths self-efficacy, hope, and student engagement.
Discussion and Implications
The aim of this study was to examine the relationship of strengths self-efficacy (Zhao et al., 2010) and hope (Snyder et. al., 1991) to the individual values of the SCM (consciousness of self, congruence, and commitment) given their relationship to leadership in the literature (Bennis & Goldsmith, 1994; Clifton & Harter, 2003; Clifton et al., 2006). Our results suggest that strengths self-efficacy is correlated with the individual values of the SCM and that strengths-based tools such as the Clifton StrengthsFinder inventory may be useful in helping students gain a strong sense of self-efficacy regarding their talents.
The Clifton StrengthsFinder, assists students in identifying and giving language to their talents and strengths. Programs such as StrengthsQuest, provide students with resources and activities to better understand, affirm, develop and apply their talents. Therefore, leadership educators are encouraged to consider the role of strengths-based development models in building leadership capacity across individual SCM values. Dugan and Komives’ (2010) findings on leadership self- efficacy, support the idea that the “appraisal of one’s self-efficacy in a particular domain plays a contributory role in functioning within that domain” (p. 540). As such, educators could integrate the use of instruments such as the Strengths Self- Efficacy Scale in the appraisal of student’s strengths self-efficacy to address one’s belief in applying their talents in a leadership capacity.
Our findings on hope reveal a potential need to integrate exercises that focus on hope development to support growth in consciousness of self, congruence, and commitment. This raises many interesting questions for leadership development researchers given its virtual omission in the context of college student development literature. Should our findings be replicated across subsequent studies, student programs and services may need to examine the role of hope within leadership and student development models. Further exploration of the cultivation of hope may help leadership educators facilitate its development across the individual values of the SCM. Suggestions for developing hope include the clarification of individual and group goals, identifying steps to reaching goals, developing alternative plans, finding satisfaction in the process, and creating strategies for overcoming obstacles (Hodges & Clifton, 2004).
Lastly, the results support the positive relationship between student engagement and the individual values of the SCM (Dugan & Komives, 2007). However, results did not indicate community involvement, gender or race to be correlated with individual predictors of the SCM as identified in previous research (Dugan & Komives, 2007). That being said, community involvement (Dugan, 2006b; Dugan et al., 2011; Dugan & Komives, 2007; Dugan & Komives, 2010; Haber & Komives, 2009), race and gender (Dugan et al., 2008; Dugan & Komives, 2007) have support within leadership literature. As such, these results should be interpreted with caution given these findings may be result of unique differences associated with sample used in this study.
Limitations and Recommendations for Future Research
Interpretation of results should be done in the context of limitations when generalizing results to the broader college population. These limitations point to future research that may be helpful in exploring predictors of the individual values of the SCM further. First, this study was limited to participants enrolled in co- curricular leadership seminars. This sample was appropriate given the purpose of the study. However, students at this institution self-select into leadership seminars which can introduce bias into the interpretation of results. The SCM is designed as an inclusive model, applicable to all students without regard for leadership position (HERI, 1996). Students outside this historically over-studied population should be included in greater numbers and with more intention in future research.
Other instruments examining student engagement and community involvement exist with greater generalizability given the existing literature, and should be considered. For example, the National Survey of Student Engagement (NSSE) has been taken by over one million students (Pascarella & Colleagues, 2007) and is reported to demonstrate good reliability and validity (Kuh, 2001; Whitefield, 2001). Using the College Student Engagement Survey (CSES) in this study supported past findings regarding the relationship of engagement to elevated capacities within the SCM. However, the measurement of community involvement may be more sensitive the specific measures used with respect to the SCM.
In summary, this study found that strengths self-efficacy and hope are related to the individual values of the SCM. Furthermore, results build upon previous literature confirming the relationship between student engagement and SCM values. These results can be useful to leadership development educators in enhancing the effectiveness of leadership programs that incorporate the SCM. Given the growing use of the SCM, StrengthsQuest and the popularity of positive student development, these findings may be helpful to educators who are working to develop leadership capacity in various campus settings.
References
Astin, A. W. (1993). What matters in college?: Four critical years revisited. San Francisco: Jossey-Bass.
Astin, A. W., & Astin, H. S. (Eds.) (2000). Leadership reconsidered: Engaging higher education in social change. Battle Creek, MI: W. K. Kellogg Foundation.
Avolio, B. J., Gardner, W. L., Walumbwa, F. O., Luthans, F., & May, D. R. (2004). Unlocking the mask: A look at the process by which authentic leaders impact follower attitudes and behaviors. Leadership Quarterly 15, 801-823.
Bennis, W. (1999). The leadership advantage. Leader to Leader, 12, 1-7.
Bennis, W., & Goldsmith, J. (1994). Learning to lead: A course on becoming a leader. Reading, MA: Addison-Wesley.
Cantwell, L. (2005). A comparative analysis of strengths-based versus traditional teaching methods in a freshman public speaking course: Impacts on student learning and engagement. Dissertation Abstracts International, 67(02A), 478-700. (UMI No. AAT3207574)
Cerff, K. (2006). The role of hope, self-efficacy and motivation to lead in the development of leaders in the South African college student context. Doctoral Dissertation, Regent University, VA.
Cerff, K., & Winston, B. E. (2006). The inclusion of hope in the servant leadership model: An extension of Patterson and Winston’s models [pdf document]. Retrieved from http://www.regent.edu/acad/sls/publications/conference_proceedings/serva nt_leadership_roundtable/2006/pdf/cerff_winston.pdf.
Clifton, D. O., Anderson, E., & Schreiner, L. A. (2006a). StrengthsQuest: Discover and develop your strengths in academics, career, and beyond. New York: Gallup.
Clifton, D. O., Anderson, E., & Schreiner, L. A. (2006b). Investing in strengths. In K. S. Cameron, J. E. Dutton, & R. E. Quinn (Eds.), Positive organizational scholarship (pp. 111-121). San Francisco: Berrett-Koehler.
Clifton, D. O., & Harter, J. K. (2003). Investing in strengths. In K. S. Cameron, J. E. Dutton & R. E. Quinn (Eds.), Positive organizational scholarship: Foundations of a new discipline, pp. 111-121. San Francisco: Berrett- Kohler.
Courville, T., & Thompson, B. (2001). Use of structure coefficients in published multiple regression articles: ÿ is not enough. Educational and Psychological Measurement, 61, 229-248.
Dugan, J. P. (2006a). Explorations using the social change model: Leadership development among college men and women. Journal of College Student Development, 47, 217-225.
Dugan, J. P. (2006b). Involvement and leadership: A descriptive analysis of socially responsible leadership. Journal of College Student Development, 47, 335-343.
Dugan, J. P., Bohle, C. W., Gebhardt, M., Hofert, M., Wilk, E., & Cooney, M. A. (2011). Influences of leadership program participation on students’ capacities for socially responsible leadership. Journal of Student Affairs Research and Practice, 48, 65.
Dugan, J. P., & Komives, S. R. (2010). Influences on college students’ capacity for socially responsible leadership. Journal of College Student Development, 51, 525- 549.
Dugan, J. P., & Komives, S. R. (2007). Developing leadership capacity in college students: Findings from a national study. A Report from the Multi- Institutional Study of Leadership. College Park, MD: National Clearinghouse for Leadership Programs.
Dugan, J. P., Komives, S. R., & Segar, T. C. (2008). College student capacity for socially responsible leadership: Understanding norms and influences of race gender, and sexual orientation. NASPA Journal, 45, 475-500.
Goethals, G. R., Sorenson, G. J., & Burns, J. M. (Eds.). (2004). Encyclopedia of leadership (Vol. 2). Thousand Oaks, CA: Sage.
Haber, P., & Komives, S. R. (2009). Predicting the individual values of the social change model of leadership development: The role of college students’ leadership and involvement experiences. Journal of Leadership Education, 9, 146-178.
Hagedoorn, M., & Molleman, E. (2006). Facial disfigurement in patients with head and neck cancer: The role of social self-efficacy. Health Psychology, 25, 643-647. 12
Harter, J. K., Schmidt, F. L., Killham, E. A., & Agrawal, S. (2009). Q Meta Analysis: The Relationship between engagement at work and organizational outcomes. Washington, DC: Gallup University Press.
Helland, M. R., & Winston, B. E. (2005). Towards a deeper understanding of hope and leadership. Journal of Leadership & Organizational Studies, 12, 42-55.
Henson, R. K. (1999). Multivariate normality. What is it and how is it assessed? In B. Thompson (Ed.), Advances in social science methodology (pp.193- 211). Stamford, Connecticut: JAI Press.
Henson, R. K. (2000). Demystifying parametric analyses: Illustrating canonical correlation as the multivariate general linear model. Multiple Linear Regression Viewpoints, 26, 11.
Henson, R. K. (2002, April). The logic and interpretation of structure coefficients in multivariate general linear model analyses. Paper presented at the annual meeting of the American Educational Research Association, New Orleans.
Hodges, T. D., & Clifton, D. O. (2004). Strengths-based development in practice. In P. A. Linley & S. Joseph (Eds.), International handbook of positive psychology in practice: From research to application (pp. 256-268). New York: Wiley.
Higher Education Research Institute (1996). A social change model of leadership development: Guidebook version III. College Park, MD: National Clearinghouse for Leadership Programs.
Humphreys, M. J. (2007). Predictors of socially responsible leadership: Application of the social change model to an Eastern European undergraduate population (doctoral dissertation). Azusa Pacific University, Azusa, CA.
Kezar, A. J., Carducci, R., & Contreras-McGavin, M. (2006). Rethinking the “L” word in higher education: The revolution in research on leadership. ASHE Higher Education Report, 31. San Francisco, CA: Jossey-Bass.
Kezar, A., & Morairty, D. (2001). Expanding our understanding of student leadership: A study exploring gender and ethnic identity. Journal of College Student Development, 41, 55-69.
Kimble, A. (2001). The basic concepts of the general linear model (GLM): Canonical correlation analysis (CCA) as a GLM. Paper presented at the 24th Annual Meeting of the Southwest Educational Research Association, New Orleans, LA
Komives, S. R., Wagner, W., & Associates (2009). Leadership for a better world: Understanding the social change model of leadership development. San Francisco: Jossey-Bass.
Komives, S. R., Dugan, J. P., Owen, J. E., Slack, C., Wagner, W., & Associates (2011). The handbook for student leadership development. (2nd ed.). San Francisco: Jossey-Bass.
Kuh, G. D. (2001). The National Survey of Student Engagement: Conceptual framework and overview of psychometric properties. Bloomington, IN: Indiana University, Center for Post-Secondary Research.
Lopez S. J., & Louis, M. O. (2009). The principles of strengths-based education. Journal of College & Character, 5, 1-8.
Lopez, S. J. (2009). Gallup student poll national report. Omaha, NE: Gallup.
Luthans, F., & Avolio, B. (2003). Authentic leadership: A positive development approach. Positive Organizational Scholarship. Retrieved from http://www.cba.unl.edu/people/article.asp?ID=1 2
Multi-Institutional Study of Leadership (2011). History. Retrieved from http://www.leadershipstudy.net/ir-history.html.
Multon, K. D., Brown, S. D., & Lent, R. W. (1991). Relation of Self-efficacy beliefs to academic outcomes: A meta-analytic investigation. Journal of Counseling Psychology, 38, 30-38.
Pascarella, E. T., & Colleagues (2007). Methodological report for the Wabash National Study of Liberal Arts Education. Retrieved from http://www.liberalarts.wabash.edu/storage/ValidationofNSSEBenchmarch s_PascarellaErAl_ASHE08linked.pdf.
Pascarella, E. T., & Terenzini, P. T. (2005). How college affects students: A third decade of research. San Francisco: Jossey-Bass.
Pedhazur, E. J. (1997). Multiple regression in behavioral research: Explanation and prediction (3rd ed.). Fort Worth: Harcourt Brace.
Quaye, S. (2007). Hope and learning: The outcomes of contemporary student activism. About Campus, 12, 2-9.
Rand, K. L., & Cheavens, J. S. (2009). Hope theory. In S. J. Lopez & C. R. Synder (Eds.), Oxford Handbook of Positive Psychology (2nd ed.) (pp.323-333). New York: Oxford University Press.
Rath, T., & Conchie, B. (2009). Strengths-based leadership: Great leaders, teams, and why people follow. New York: Gallup.
Seligman, M. E. P., & Csikszentmihalyi, M. (2000). Positive psychology: An introduction. American Psychologist, 55, 5-14.
Sherry, A., & Henson, R. K. (2005). Conducting and interpreting canonical correlation analysis in personality research: A user-friendly primer. The Journal of Personality Assessment, 84, 37-48.
Shorey, H. S., & Snyder, C. R. (2004). Development and validation of the domain hope scale revised. Unpublished manuscript, University of Kansas, Lawrence, KS.
Snyder, C. R. (1995). Conceptualizing, measuring, and nurturing hope. Journal of Counseling & Development, 73, 355-360.
Snyder, C. R. (2002). Hope theory: Rainbows in the mind. Psychological Inquiry, 13, 249-275.
Snyder, C. R., Harris, C., Anderson, J. R., Holleran, S. A., Irving, L. M., Sigmon, S. T., et al.(1991). The will and the ways: Development and validation of an individual-differences measure of hope. Journal of Personality and Social Psychology, 60, 570-585.
Tabachnick, B. G., & Fidell, L. S. (2007). Using multivariate statistics (5th ed.). New York: Pearson Education.
The Gallup Corporation (2011). Who uses StrengthsQuest? Retrieved from http://www.strengthsquest.com/content/141728/index.aspx.
Tyree, T. M. (1998). Designing an instrument to measure socially responsible leadership using the social change model of leadership development. Dissertation Abstracts International, 59, (06), 1945. (AAT9836493).
Vacha-Haase, T., & Thompson, B. (2004). How to estimate and interpret various effect sizes. Journal of Counseling Psychology, 51, 473-481.
Walumbwa, F. O., Luthans, F., Avey, J. B., & Oke, A. (2011). Authentically leading groups: The mediating role of collective psychological capital and trust. Journal of Organizational Behavior, 32, 4-24.
Whitfield, C. E. (2001). A report on the National Survey of Student Engagement. Research brief. Frankfort, KY: Kentucky Council on Postsecondary Education. (ERIC Document Reproduction Service No. ED469485).
Wilkinson, L., & APA Task Force on Statistical Inference (1999). Statistical methods in psychology journals: Guidelines and explanations. American Psychologist, 54, 594-604.
Worrell, F. C., & Hale, R. L. (2001). The relationship of hope in the future and perceived school climate to school completion. School Psychology Quarterly, 16, 370-388.
Zhao, R. Tsai, C., Chaichanasakul, A., Flores, L.Y., & Lopez, S. (2010). A Validity and Reliability Study of the Strength Self-Efficacy Poster presented at the 118th Annual Meeting of the American Psychological Association, San Diego.
Zimmerman-Oster, K., & Burkhardt, J. C. (1999). Leadership in the making: Impact and insights from leadership development programs in U.S. colleges and universities. Battlw Creek, MI: W. K. Kellogg Foundation.
Acknowledgements
This study was supported in part by a Region III Grant of the National Association of Student Personnel Administrators (NASPA). The authors would also like to acknowledge Dr. Shane Lopez and The Gallup Organization for their assistance regarding Strengths Self-Efficacy Scale.