Introduction and Theoretical Framework
Leadership development is an essential aspect of the Texas FFA and the state’s Agriculture, Food, and Natural Resource (AFNR) program, which will hence forth be noted as FFA programs. Leadership has been a foundation of the FFA since 1928 (Hoover, Scholl, Dunnigan, & Mamontova, 2007). There are Leadership Development Events (LDEs) in which students may compete, leadership camps for students to learn how to become great leaders, and leadership positions for students to hold at local, district, area, state and national levels. In fact, FFA members have more leadership and personal development abilities than do non-members, and the leadership traits of youth can be enhanced by participation in FFA activities (Rutherford, Townsend, Briers, Cummings, & Conrad, 2002). Is there a leadership style that is more effective than others for educators who are tasked with the development of today’s AFNR students?
Success in the FFA can have different meanings for different audiences. This study uses the term “successful” to represent an FFA program that received a Golden Horizon Award in a recent school year, and the advisor had been part of that particular program for at least four years. This definition was created to describe a program that is not only well-rounded but also has had success in its contests and is not simply competing for the fun of it.
This study defines leadership as it is determined by Northouse (2010), who defined leadership as “a process whereby an individual influences a group of individuals to achieve a common goal” (p. 3). This leadership definition was selected because throughout the FFA, teams of students, multi-teacher departments, and classrooms are full of students and educators working towards a common goal: students may be participating in the Agricultural Technical and Mechanical Systems Career Development Event (CDE), showing heifers at the Houston Livestock Show and Rodeo, or simply working together on a community service project.
Throughout the FFA, a key factor in the leadership that defines, encompasses, and takes place throughout the organization, is the FFA advisor or agricultural educator.
Transformational Leadership. A major aspect of leadership that has been given considerable attention in recent research is that of leadership styles. The theory of transformational leadership served as the theoretical framework for this study. Some leadership researchers have placed transactional and transformational leadership on a continuum, where a leader falls somewhere along the line between the two, exhibiting combinations of both styles (Burns, 1978). Others view these two approaches as complementary constructs, which suggests that leaders can exhibit and engage in both leadership behaviors: allowing for the idea that transactional leadership is not a substitute for transformational leadership, but rather adds to its effectiveness e.g., (Bass, 1997). Understanding how teacher leadership styles may influence students’ perceptions may help educators understand how their interaction with students can be used to motivate students, thereby helping to improve the success of students (Kelly, 2000). It is important to first elaborate on the different aspects of each leadership style in this theory.
The “transformational leadership theory is part of the ‘New Leadership Paradigm’ (Bryman, 1992), which gives more attention to the charismatic and affective elements of leadership” (Northouse, 2010, p. 171). Transformational leadership involves an exceptional form of influence that moves followers to accomplish more than what is usually expected of them, often incorporating charismatic and visionary leadership into its context (Northouse, 2010). The transformational leadership style is best represented by a person who engages with others and creates a connection that raises the level of motivation and morale in both the leader and the follower. This type of leader is attentive to the needs and motives of followers and tries to help followers reach their fullest potential (Northouse, 2010). According to Bass (1985), the transformational leader raises the level of awareness about the importance and value of desired outcomes and expands the wants and needs of followers to surpass their own self-interest for the sake of the group.
Transformational leadership is composed of five different factors: Idealized Influence (Attributed), Idealized Influence (Behaviors), Inspirational Motivation, Intellectual Stimulation, and Individualized Consideration (Greiman, Addington, Larson, & Olander, 2007). Idealized Influence is defined in terms of how followers react to the leader and the leader’s behavior (Moore & Rudd, 2006). Avolio and Bass (2004) noted that Idealized Influence is both an impact and a behavior; thus, two leadership factors are required to describe it. Leaders that exhibit Idealized Influence are admired and respected by followers, they have high standards of moral and ethical behavior, along with a charisma that provides followers with a sense of mission (Greiman, et al, 2007; Moore & Rudd, 2006). Inspirational Motivation describes the ability of a leader to communicate high expectations to followers and motivate them as well to become committed, taking vested interest in a shared vision (Northouse, 2010). The fourth factor of transformational leadership is that of Intellectual Stimulation. Leaders that exhibit Intellectual Stimulation tend to question old assumptions, traditions, and beliefs guiding and stimulating followers to develop new perspectives and ways of doing things (Harms & Knobloch, 2005). The final element of transformational leadership is Individualized Consideration. This factor represents leaders who are supportive, good listeners, and act as coaches and mentors to followers (Northouse, 2010). They treat followers as unique individuals, often giving various levels of direction to different individuals. They use their leadership style which focuses on the development of good teacher-student relationships as an effective tool to enhance student motivation (Kelly, 2000).
Transactional Leadership. Transactional leadership differs from transformational leadership in that the transactional leader does not individualize the needs of subordinates or focus on their personal development (Burns, 1978; Northouse, 2010). The transactional leadership model consists of three different factors: Contingent Reward, Management-by- Exception (active), and Management-by-Exception (passive) (Greiman et al, 2007). Contingent Reward refers to the engagement of leaders and followers in an exchange process, in which effort by followers is exchanged with a specific reward (Moore & Rudd, 2006). Management-by- Exception has two different categories based on how the leader acts. In the Management-by- Exception (Active) form, the leader closely monitors followers for mistakes and then takes corrective action (Greiman et al, 2007). In the Management-by-Exception (Passive) form, which is a subscale of the laissez-faire leadership style, the leader intervenes when the problem becomes serious or standards have not been met (Greiman et al, 2007). In both forms, corrective criticism, negative feedback, and negative reinforcement are defining characteristics. A transactional leader is influential because it is in the best interest of subordinates for them to do what the leader wants (Northouse, 2010).
Laissez-Faire Leadership. This laissez-faire style of leadership characterizes the leader who takes a hands-off approach by abdicating responsibility, delaying decisions, providing little to no feedback and making little effort to help followers satisfy their needs (Northouse, 2010).
This type of leader simply gives the work or project to the followers and allows them to determine the outcome of the project, and is satisfied with the outcomes that are produced, regardless of the quality. The style of leadership that a laissez-faire leader uses is not always ineffective. When this type of leader is able to select qualified followers, then the success of the goal is in fact, still very much achievable at high standards of quality.
Conceptual Framework, Related Research and Significance of the Study
This study drew on three main categories of leadership research: leadership styles and education, characteristics of successful agricultural education and FFA programs, and the amount of teaching experience and its effect on leadership. Little research exists on how the leadership style of an FFA advisor affects the success of a program. Therefore, this research sought to describe the leadership styles and practices of FFA advisors who lead successful programs, based on the transformational leadership theory.
Leadership Education and Training. Within the literature, educational background and leadership training related to agricultural education and the FFA has received less attention than other variables. According to Simonsen and Birkenholz (2010), leadership coursework being offered by agriculture teacher education programs has increased slightly over the past years.
However, most programs in the United States do not require coursework in leadership as a part of the teacher preparation program (Simonsen & Birkenholz, 2010). This is disheartening, since the FFA places a lot of importance on the leadership development of today’s youth. Furthermore, transformational leadership practices can be taught and learned (Kouzes & Posner, 2007).
Additionally, majors in leadership are becoming a common theme at universities, but universities have not yet come to a consensus on what a consistent curriculum should contain (Brungardt, Greenleaf, Brungardt, & Arensdorf, 2006). Leadership content addressed in required courses yields an extensive list of topics, with the most popular content being leadership styles and categories (Greiman et al, 2007). Research on leadership education has led to the discovery that “one-shot programs” add awareness, but are ineffective in creating true learning and behavioral changes in leadership, suggesting that leadership education needs to be conducted over an extended period of time (Townsend, 2002). An important consideration in the education of future agricultural educators and FFA advisors is what type of leadership training is needed to produce successful agriculture educators. Agricultural teacher education programs at universities, and organizations such as the Vocational Agriculture Teachers Association of Texas (VATAT), an association that informs agriculture teachers about the latest agricultural education practices and encourages higher standards of teaching agriculture, can create leadership skills and abilities workshops, much like they do for other areas of professional development (http://www.vatat.org).
Quality Indicators of Successful Agriculture Education and FFA Programs. Previous research on the characteristics of agricultural education programs exists, but has produced large amounts of qualitative data, which lacks agreement on precisely what characteristics make up a successful program. Ullrich (1997) produced a list of 70 different aspects that are characteristics of a quality program. A later study conducted by Jenkins and Kitchel (2009) found 13 different statements that describe a quality FFA program and 25 supervised agriculture experience or “SAE” statements that describe a quality program.
Furthermore, Roberts and Dyer (2004) found 40 different statements that characterize an effective agriculture teacher. These studies show that there is an interest in what elements are needed in successful or quality agricultural education or FFA programs. These studies found that the advisors and teachers of quality programs are caring, have high moral standards and expectations for students, and the teacher mentors or guides the students through the program’s activities (Ullrich, 1997; Roberts & Dyer, 2004; Jenkins & Kitchel, 2009). The aspects mentioned above can all be related to the transformational leadership theory at its core level; however, none of these studies addressed what precisely are the leadership styles of individuals who lead quality FFA programs. The significance in understanding what leadership aspects or qualities characterize a successful agricultural education program or the teacher/ advisor is to recognize what the characteristics actually are, so that when school districts and universities are training and hiring individuals to lead these programs they can have a clear idea of what type of individual is desired to lead their programs. Personality questionnaires have been gaining widespread attention and recognition from hiring managers over the last few years. Leadership profiling instruments have also been widely used in many other contexts, so could school boards, superintendents, principals, and career and technical education (CTE) directors who may all play a part in the hiring process of agriculture educators, use them in the employment process for agriculture teachers (Tomlinson & Holmes, 2000)?
Leadership Styles and Years of Teaching Experience. Very little research was found that reported the relationship between leadership styles and the years of teaching experience in FFA/AFNR. Lord, De Vader, and Alliger (1986) reported that less experienced teachers were likely to exhibit a transformational leadership style. In other related literature, Moore and Rudd (2006) determined that tenure of extension leaders was a predictor of both transactional and transformational leadership styles. Furthermore, in a study comparing the teaching efficacy of first- and fifth-year agriculture teachers, it was determined that fifth-year teachers have higher self-efficacy in regards to their teaching ability than do first-year teachers (Burris, McLaughlin, McCulloch, Brashears, & Fraze, 2010); therefore, making assumptions about how years of experience affect leadership styles was difficult. Generally speaking, the longer an individual is in a position, the more likely they are to establish a consistent leadership style.
Limitations of the Study. A limitation of this study was not including programs and their teachers that fall outside of the factors that have been set up to define successful programs. More research into this topic is needed to discover how leadership styles of FFA advisors or agricultural educators impact success, using a different criterion of success, such as academic success of the students. For example, this study used an award as the defining element of success. Program success may also come from a large variety of measures, such as students continuing their education beyond high school or entering the workforce, reducing dropout rates, teaching transferrable skills, etc. A second limitation of the study included the parameters set for teachers within a program, in which participants must have had at least four years at that particular school. It is possible that a teacher may have contributed to a program’s success after two or three years, not four. Lastly, this study relied on drawing a significant cause and effect conclusion from the data of which leadership style, if possessed by an FFA advisor, would create the best opportunity for a leader to develop a successful program. The study remedied this limitation by asserting that there will be a high correlation between leadership styles and the success of a program. The conclusion and inferences drawn from this research are predictive of a leadership style that would be preferential for program leaders to possess or develop.
Purpose and Objectives. The purpose of this study was to identify and describe the leadership styles and practices of FFA advisors/AFNR (Agriculture, Food, and Natural Resource) teachers who lead successful FFA programs. The terms “FFA advisor” and “AFNR teacher” are commonly used interchangeably in the scope of agriculture education, and “FFA
advisor” will be used in this context. The predominant question is whether a transactional leadership style is more predictive of FFA program success than the transformational or laissez- faire leadership styles. The specific objectives of the proposed study were to:
- Describe current Texas FFA advisors/AFNR teachers of successful FFA chapters in terms of their leadership styles;
- Describe current Texas FFA advisors/AFNR teachers of successful FFA chapters in terms of their leadership training/educational background; and
- Determine and describe how AFNR teachers can use their different leadership styles to improve their
Methods and Materials. The target population of this study was all current FFA advisors who are leading or are in charge of successful FFA programs in Texas. Data for this study was collected in two stages. Being that this study included a review of the leadership styles of a specific group of FFA advisors, the research conducted a census when gathering data. First, the population was selected based on two specific criteria. The purposeful selection of the advisors, based on specific criteria for this study, was done in order to determine FFA chapters and programs that are considered to be of the highest quality (Nash, Sproule, & Horton, 2011).
The criteria that each individual in this study met in order to be selected were, (a) the teacher must have had at least four years of teaching experience at the particular program, and (b) the FFA advisor must have been currently leading an FFA chapter that earned the Golden Horizon Award in the 2013-2014 school year. The research put a preference on teachers that had four or more years of experience at one particular program, under the assumption that after four years of experience in one career and at one location, those individuals would have developed a consistent leadership style and were less likely to be going through the initial shock of adjusting to a new or first career. Furthermore, having four or more years at a single program helped ensure that the advisor was not simply picking up a successful program, and therefore he or she had the opportunity to shape the students with their own leadership style.
Using the Golden Horizon Award as a standard level of success in the FFA was chosen because it provides a good representation of what a well-rounded and successful chapter should strive to be. The Golden Horizon Chapter Recognition program is broken into three different levels: bronze, silver, and gold. It is a state level award to provide a measurement tool for chapter officers and advisors and recognize chapters who succeed in involving a large number of members in the diverse array of activities available through the FFA (Texas FFA Association, 2013). This award represented chapters that have done well in a variety of activities: leadership development events (LDE); career development events (CDE); proficiency award program participation; Agri-Science, miscellaneous and work-based learning awards participation; agricultural industry and degree participation; and officer and miscellaneous activity participation (Texas FFA Association, 2013). According to the 86th Annual Texas FFA State Convention pamphlet, the number of chapters that received a Golden Horizon award was 241. Along with ensuring that all participants in this study had reached the set criteria, the study sought a response rate of 70% so that the conclusions and inferences developed from this study could be generalized to a larger population. To address the issue of non-response bias, a random sample of 20 non-respondents was contacted and “double-dipped”, and the resulting data was separated into groups of early and late respondents, and then compared for any statistical differences that arose (Lindner, Murphy, & Briers, 2001). The researchers understood that such a
response rate would be difficult to achieve due to the set parameters: the number of chapters that had reached the criteria (Golden Horizon Award) was known, but it was not known if the current teachers had led those programs to that element of success. The FFA advisor of the programs that were initially deemed eligible for the study were identified using JudgingCard.com, which is a public website utilized by AFNR teachers to register for various event throughout the year.
Email addresses were located and accessed through the directory of the JudgingCard website. After the eligible FFA advisor’s contact information was identified and located from JudgingCard, all participants were sent an initial email with the appropriate informed consent notification, survey instructions, and completion date. A follow-up email was sent two weeks later to remind FFA advisors to complete the instrument and survey. Subsequent emails were sent out every two weeks until a total of four emails were sent to the individual participants.
Instrumentation. The Multifactor Leadership Questionnaire Form 5X (MLQ5X) instrument was sent to the selected individuals, along with a biographical page, in order to determine leadership styles and to receive demographic data on the individuals. The MLQ5X Form was chosen for this study because it has proven to be a statistically valid and highly accurate tool for determining the leadership styles of individuals (Muenjohn & Armstrong, 2008). The MLQ 5X Form contained 45 items tapping the nine distinct leadership factors and the three leadership outcomes that were previously discussed (Muenjohn & Armstrong, 2008). The questionnaire had a scale score ranging from 0-4 as the response choices, allowing the participant to assess their own leadership qualities, where 0=not at all, 1=once in a while, 2=sometimes, 3=fairly often, and 4=frequently, if not always (Muenjohn & Armstrong, 2008).
Furthermore, the MLQ5X Form is the most widely used instrument to assess transformational and transactional leadership theory and is considered the best validated measure of transformational and transactional leadership (Muenjohn & Armstrong, 2008). The reliabilities of the MLQ5X Form for each scale range from .74 to .91 (Bass and Avolio, 2000). Once the data was collected, it was analyzed with SPSS to create the comparative bar charts and regression tables. Other descriptive statistics such as frequencies and standards of deviation were also created with the use of SPSS statistical software.
Results. The purpose of this study was to identify and describe the leadership styles and practices of FFA advisors/AFNR teachers who lead successful FFA programs. Although previous research has addressed similar leadership competencies of agricultural educators, the relationship between leadership styles and FFA program success has little, if any, complete research in current literature. The predominant question was whether a transformational leadership style was more predictive of FFA program success than transactional or laissez-faire leadership styles. The analysis sought to describe current FFA advisors of successful FFA chapters in terms of their leadership styles.
Pre-Analysis Data Review. The survey was originally sent to 371 individuals, of which 46 participants were removed for unresolvable email issues, leaving 325 participants that received the survey. The researcher originally received 155 responses to the survey. From those received, 48 respondents were removed for not having the minimum years of teaching at their current school, defined as four years. Thus, the final data was comprised of 107 participants, and providing a response rate of 32.92%. To account for the non-response bias in this study, a random sample of participants was doubled dipped, and no significant differences were found between early and late respondents.
Descriptive Statistics Frequencies and Percentages of Demographics. In order to better understand the population of this study, each participant was asked to respond to questions pertaining to their demographics and leadership education. Of the 107 participants, 77 were male (72.0%) and 30 were female (28.0%). The vast majority of participants were Caucasian (n=105, 98.1%) and the remainder were Hispanic (n=2, 1.9%). Most of the participants’ highest college degree was a B.S. (n=54, 50.5%) with the remainder having an M.S. (n=24, 22.4%), M.Ed. (n=28, 26.2%), or an Ed.D. (n=1, 0.9%). The largest number of participants were teaching in the FFA’s Area III (n=23, 21.5%). The majority taught in a multiple teacher department (n=96, 89.7%). Of the 107 usable responses, 100 (93.5%) received at least some leadership training or education through college courses, 102 (95.3%) receive such training through attending workshops, 62 (57.9%) by participating in online training, and 11 (10.3%) through other types of courses. It must be noted that the participants reported having received leadership training by more than one method. Most of the participants reported having a modest amount, or “quite a bit”, of leadership training (n=45, 42.1%). The vast majority of participants (n=104, 97.2%) received ongoing professional development training from the annual state teachers’ conference. The frequencies and percentages of the demographic information along with leadership training are presented in Table 1.
Table 1
Frequencies and Percentages of Demographics
| Demographic | n | % |
| Gender | ||
| Male | 77 | 72.0 |
| Female | 30 | 28.0 |
| Ethnicity | ||
| White/Caucasian | 105 | 98.1 |
| Hispanic | 2 | 1.9 |
| What is your highest degree earned? | ||
| B.S. | 54 | 50.5 |
| M.S. | 24 | 22.4 |
| M.Ed | 28 | 26.2 |
| Ed.D.
Ph.D |
1
0 |
0.9
0 |
| What FFA area do you teach in? | ||
| I | 6 | 5.6 |
| II | 1 | 0.9 |
| III | 23 | 21.5 |
| IV | 14 | 13.1 |
| V | 9 | 8.4 |
| VI | 8 | 8.4 |
| VII | 15 | 14.0 |
| VIII | 12 | 11.2 |
| IX | 13 | 12.1 |
| X | 6 | 5.6 |
| Do you teach in a single or multiple teacher department? | ||
| Single | 11 | 10.3 |
| Multiple | 96 | 89.7 |
| Type of Classes (teachers had multiple responses) | ||
| College Courses | 100 | 93.5 |
| Workshops | 102 | 95.3 |
| Online Training | 62 | 57.9 |
| Other | 11 | 10.3 |
| How much leadership training or education have you had? | ||
| Some | 33 | 30.8 |
| Quite a bit | 45 | 42.1 |
| Substantial amount | 29 | 27.1 |
| Where do you receive the majority of your professional
development? |
||
| VATAT conference | 104 | 97.2 |
| University | 3 | 2.8 |
Note: Due to rounding error, not all percentages may sum to 100.
Descriptive Statistics of Continuous Variables. To gain further knowledge about the leadership styles and success of FFA advisors, participants were asked to indicate their age, number of years teaching in their current position, and the total number of years of experience as an AFNR teacher. Participants then completed MLQ5X which mapped out their leadership styles.
The age of the participants ranged from 27 to 67 years, with M=42.71 (SD=9.28).
Experience teaching at the current school ranged from 4 to 39 years, with M=12.89 (SD=8.31). Experience teaching AFNR ranged from 4 to 40 years, with M=17.77 (SD=8.84).
Transformational leadership scores ranged from 1.70 to 3.90, with M=3.15 and SD=0.43. With possible MLQ5X scores ranging from 0 (not at all) to 4 (frequently, if not always), a mean of
3.15 was found, meaning the majority of respondents in this study frequently display transformational leadership qualities. Transformational leadership sub-scales are as follows: (1) Idealized Influence (attribute) and Idealized Influence (behavior), meaning they are revered and respected by followers and exhibit high moral and ethical standards, providing followers with a shared mission; (2) Inspirational Motivation, which allows a leader to communicate high expectations that motivate followers to become committed to a shared vision; (3) Transformational leadership as Intellectual Stimulation, as followers are encouraged to challenge old assumptions and stimulate new and creative perspectives; and, (4) Individual Consideration, where the leader provides individual attention to the needs of followers, often giving different levels of direction and support when necessary. The sub-scale scores of transformational leadership were: Idealized Influence attribute scores ranged from 1.25 to 4.00, with M=3.09 and SD=0.52. Idealized Influence behavior ranged from 2.00 to 4.00, with M=2.19 and SD=0.49. Inspirational Motivation ranged from 1.25 to 4.00, with M=3.18 and SD=0.59. Intellectual Stimulation scores ranged from 1.75 to 4.00, with M=2.93 and SD=0.53. Individual Consideration scores ranged from 1.75 to 4.00, M=3.39 and SD=0.50. This shows that FFA leaders exhibit a higher tendency towards the transformational leadership style.
Transactional leadership scores ranged from 1.38 to 3.75, M=2.45, SD=0.49. The sub-scales of transactional leadership correspond to Contingent Reward, whereby leaders engage their followers through an exchange of rewards for effort on the part of the followers, and Management by Exception (Active) where the leader closely monitors followers and takes quick and decisive corrective action. Contingent Reward scores ranged from 1.75 to 4.00, M=3.15, SD=0.54. Management by Exception (Active) scores ranged from 0.25 to 4.00, M=1.72, SD=0.78. With these scores being lower than those of transformational leadership but still at a relatively high level, it shows that leaders will use a transactional style of leadership when necessary.
Laissez-faire leadership ranged from 0.00 to 2.88, M=0.86, SD=0.55. The sub-scales of laissez-faire leadership are laissez-faire, hands off, and Management by Exception (Passive), which entails waiting until the problem has become severe, before interfering. Laissez-faire leadership sub-scale scores ranged from 0.00 to 3.25, M=2.45, SD=0.49. Management by Exception (Passive) scores ranged from 0.00 to 2.75, M=1.01, SD=0.61. This demonstrates that leaders of FFA programs in this study hardly ever exhibit the laissez-faire leadership style.
Participants on average generated higher transformational leadership scores when compared to transactional and laissez-faire leadership. Descriptive statistics of the continuous variables are
presented in Table 2. Bar charts for transformational, transactional, and laissez-faire leadership scores are presented in Figures 1–3.
Table 2
Descriptive Statistics of Continuous Variables
| Continuous Variables | Min. | Max. | M | SD |
|
Age |
27 |
67 |
42.71 |
9.28 |
| Years Teaching at Current School | 4 | 39 | 12.89 | 8.31 |
| Years as an AFNR Teacher | 4 | 40 | 17.77 | 8.84 |
| Transformational Leadership | 1.70 | 3.90 | 3.15 | 0.43 |
| Idealized Influence Attribute | 1.25 | 4.00 | 3.09 | 0.52 |
| Idealized Influence Behavior | 2.00 | 4.00 | 3.19 | 0.49 |
| Inspirational Motivation | 1.25 | 4.00 | 3.18 | 0.59 |
| Intellectual Stimulation | 1.75 | 4.00 | 2.93 | 0.53 |
| Individual Consideration | 1.75 | 4.00 | 3.39 | 0.50 |
| Transactional Leadership | 1.38 | 3.75 | 2.45 | 0.49 |
| Contingent Reward | 1.75 | 4.00 | 3.15 | 0.54 |
| Management by Exception, (Active) | 0.25 | 4.00 | 1.72 | 0.78 |
| Laissez-Faire Leadership | 0.00 | 2.88 | 0.86 | 0.55 |
| Laissez-Faire | 0.00 | 3.25 | 2.45 | 0.49 |
| Management by Exception, (Passive) | 0.00 | 2.75 | 1.01 | 0.61 |

Figure 1. Bar chart for transformational leadership illustrating the frequencies and scores of the MLQ 5X instrument.
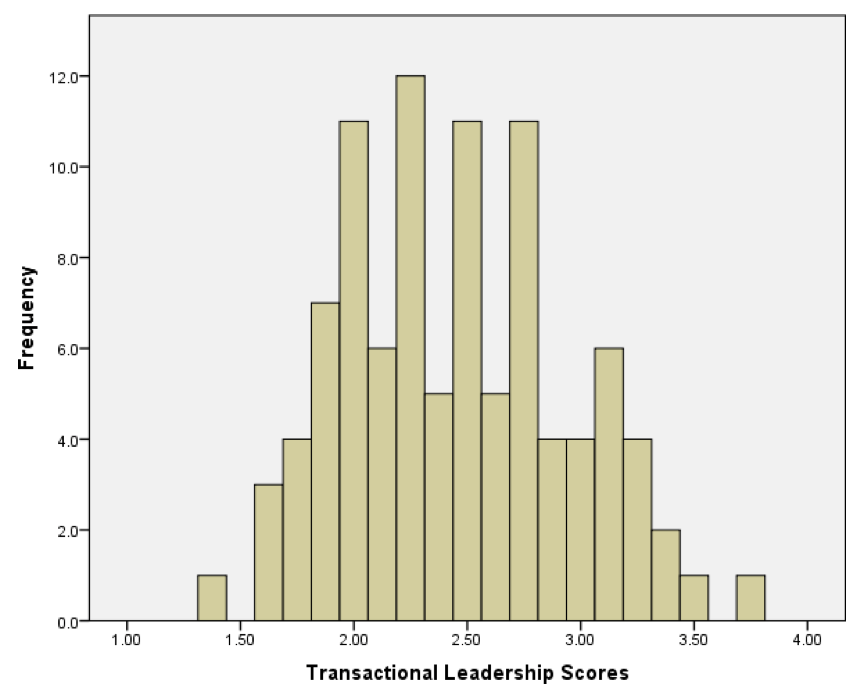
Figure 2. Bar chart for transactional leadership illustrating the frequencies and scores of the MLQ 5X instrument.

Figure 3. Bar chart for laissez-faire leadership illustrating the frequencies and scores of the MLQ 5X instrument.
Reliability. To ensure the reliability of the data collected, Cronbach’s alpha tests of reliability and internal consistency were conducted on the three leadership styles, one test per scale. The Cronbach’s alpha provides correlation of means between each pair of items and the number of items in a scale (Brace, Kemp, & Snelgar, 2012). The alpha values were interpreted using the guidelines suggested by George and Mallery (2010), where α >0.90 excellent, >0.80 good, >0.70 acceptable, >0.60 questionable, >0.50 poor, and <0.50 unacceptable. Results for transformational leadership indicated excellent reliability. Results for transactional leadership indicated questionable reliability; therefore, interpretations for this variable must be made with caution. Results for laissez-faire leadership indicated acceptable reliability. Reliability statistics for the three composite scores for leadership are presented in Table 3.
Table 3
Cronbach’s Alpha Reliability Statistic for the Three Composite Scores for Leadership
| Scale | No. of Items | α |
|
Transformational |
20 |
.90 |
| Transactional | 8 | .60 |
| Laissez-faire | 8 | .70 |
Correlations. To understand the relationship between FFA advisors of successful FFA chapters in terms of their leadership styles, the researchers proposed Pearson, point-biserial, and Spearman correlations for continuous, dichotomous, and categorical variables, respectively. A Pearson correlation is the appropriate analysis to conduct when the goal is to assess the relationship between two continuous variables (Pallant, 2010). A point-biserial correlation is appropriate when the strength of association is measured between a continuous variable and a dichotomous variable (Tabachnick & Fidell, 2012). A Spearman correlation is the appropriate analysis if one or more of the variables being paired are measured on an ordinal level (Pallant, 2010).
Transformational Leadership. Pearson correlations were conducted to understand how the continuous demographic variables of age, years at current school, and years as an AFNR teacher, correlate with transformational leadership scores. The three continuous variables of interest were age, years at current school, and years as an AFNR teacher. At the α = .05 level, none of these variables were significantly correlated with transformational leadership scores. Results of the Pearson correlations between continuous variables and transformational leadership are presented in Table 4.
Table 4
Pearson Correlation Matrix between Continuous Variables and Transformational Leadership
| Variable | 1) | 2) | 3) | 4) |
| 1) Age | 1.00 | .68* | .84* | .09 |
| 2) Years at current school | .68* | 1.00 | .76* | .09 |
| 3) Years as an AFNR | .84* | .76* | 1.00 | -.02 |
| 4) Transformational Leadership | .09 | .09 | -.02 | 1.00 |
*Correlations are significant at the .05 level (2-tailed)
Point-biserial correlations were conducted to understand how dichotomous demographic variables correlated with transformational leadership scores. The dichotomous variables of interest correspond to gender, single/multiple teacher departments, workshops, online training, and training an LDE or CDE team that has competed at the state level in the past four years. At the α = .05 level, none of the dichotomous variables were significantly related to transformational leadership scores. Results of the point-biserial correlations between dichotomous variables and transformational leadership are presented in Table 5.
Table 5
Point-Biserial Correlation Matrix between Dichotomous Variables and Transformational Leadership
| Variable | 1) | 2) | 3) | 4) | 5) | 6) | 7) |
| 1) Gender | 1.00 | .09 | -.06 | .04 | .11 | -.09 | -.07 |
| 2) Ethnicity | .09 | 1.00 | -.05 | -.03 | .02 | .06 | .04 |
| 3) Single/multiple teacher departments | -.06 | -.05 | 1.00 | .07 | .02 | .06 | .03 |
| 4) Workshops | .04 | -.03 | .07 | 1.00 | .26 | .09 | .00 |
| 5) Online training | .11 | .02 | .02 | .26 | 1.00 | .09 | .10 |
| 6) Trained team that has competed with LDE or CDE team in past four years |
-.09 |
.06 |
.06 |
.09 |
.09 |
1.00 |
-.09 |
| 7) Transformational Leadership | -.07 | .04 | .03 | .00 | .10 | -.09 | 1.00 |
*Correlations are significant at the .05 level (2-tailed)
Spearman correlations were conducted to understand the relationship between ordinal variables and transformational leadership scores. The ordinal variables of interest were highest educational degree earned and training/education in leadership. There were no significant correlations between the ordinal demographic data and transformational leadership. Results of the Spearman correlations between ordinal variables and transformational leadership are presented in Table 6.
Table 6
Spearman Correlation Matrix between Ordinal Variable and Transformational Leadership
| Variable | 1) | 2) | 3) |
|
1) Highest degree earned |
1.00 |
.15 |
-.17 |
| 2) Leadership training or education | .15 | 1.00 | .14 |
| 3) Transformational leadership | -.17 | .14 | 1.00 |
*Correlations are significant at the .05 level (2-tailed)
Transactional Leadership. Pearson correlations were conducted to understand how the continuous demographic variables age, years at current school, and years as an AFNR teacher correlate with transactional leadership scores. The three continuous variables of interest were age, years at current school, and years as an AFNR teacher. At the α=0.05 level, none of these variables were significantly correlated with transactional leadership scores. Results of the Pearson correlations between continuous variables and transactional leadership are presented in Table 7.
Table 7
Pearson Correlation Matrix between Continuous Variables and Transactional Leadership
| Variable | 1) | 2) | 3) | 4) |
| 1) Age | 1.00 | .68* | .84* | .01 |
| 2) Years at current school | .68* | 1.00 | .76* | -.03 |
| 3) Years as an AFNR teacher | .84* | .76* | 1.00 | -.19 |
| 4) Transactional Leadership | .01 | -.03 | -.19 | 1.00 |
*Correlations are significant at the .05 level (2-tailed)
Point-biserial correlations were conducted to understand how dichotomous demographic variables correlated with transactional leadership scores. The dichotomous variables of interest correspond to gender, single/multiple teacher departments, workshops, online training, and training an LDE or CDE team that has competed at the state in the past four years. At the α=0.05 level, none of the dichotomous variables were significantly related to transactional leadership scores. Results of the point-biserial correlations between dichotomous variables and transactional leadership are presented in Table 8.
Table 8
Point-Biserial Correlation Matrix between Dichotomous Variables and Transactional Leadership
| Variable | 1) | 2) | 3) | 4) | 5) | 6) | 7) |
| 1) Gender | 1.00 | .09 | -.06 | .04 | .11 | -.09 | -.10 |
| 2) Ethnicity | .09 | 1.00 | -.05 | -.03 | .02 | .06 | .14 |
| 3) Single/multiple teacher departments | -.06 | -.05 | 1.00 | .07 | .02 | .06 | .15 |
| 4) Workshops | .04 | -.03 | .07 | 1.00 | .26* | .09 | -.02 |
| 5) Online training | .11 | .02 | .02 | .26* | 1.00 | .09 | .10 |
| 6) Trained team that has competed with
LDE or CDE team in past four years |
-.09 | .06 | .06 | .09 | .09 | 1.00 | .02 |
|
7) Transactional Leadership |
-.11 | .14 | .15 | -.02 | .10 | .02 | 1.00 |
*Correlations are significant at the .05 level (2-tailed)
Spearman correlations were conducted to understand the relationship between ordinal variables and transactional leadership scores. The ordinal variables of interest were highest educational degree earned and training/education in leadership. Results of the Spearman correlations indicated a significant inverse relationship (rs=-0.24, p=0.02) between highest degree earned and transactional leadership. Results of the Spearman correlations between the ordinal variables and transactional leadership are presented in Table 9.
Table 9
Spearman Correlation Matrix between Ordinal Variable and Transactional Leadership
| Variable | 1) | 2) | 3) |
| 1) Highest degree earned | 1.00 | .15 | -.24* |
| 2) Leadership training or education | .15 | 1.00 | .13 |
| 3) Transactional leadership | -.24* | .13 | 1.00 |
*Correlations are significant at the .05 level (2-tailed)
Laissez-Faire Leadership. Pearson correlations were conducted to understand how the continuous demographic variables age, years at current school, and years as an AFNR teacher correlate with laissez-faire leadership scores. The three continuous variables of interest were age, years at current school, and years as an AFNR teacher. At the α=0.05 level, none of these variables were significantly correlated with laissez-faire leadership scores. Results of the Pearson correlations between continuous variables and laissez-faire leadership are presented in Table 10.
Table 10
Pearson Correlation Matrix Between Continuous Variables and Laissez-Faire Leadership
| Variable | 1) | 2) | 3) | 4) |
| 1) Age | 1.00 |
.68* |
.84* | -.17 |
| 2) Years at current school | .68* | 1.00 | .76* | -.03 |
| 3) Years as agricultural science teacher | .84* |
.76* |
1.00 | -.19 |
| 4) Laissez-Faire Leadership | -.17 | -.03 | -.19 | 1.00 |
*Correlations are significant at the .05 level (2-tailed)
Point-biserial correlations were conducted to understand how dichotomous demographic variables correlated with laissez-faire leadership scores. The dichotomous variables of interest correspond to gender, single/multiple teacher departments, workshops, online training, and training an LDE or CDE team that has competed at the state level in the past four years. At the α=0.05 level, none of the dichotomous variables were significantly related to laissez-faire leadership scores. Results of the point-biserial correlations between dichotomous variables and laissez-faire leadership are presented in Table 11.
Table 11
Point-Biserial Correlations Matrix between Dichotomous Variables and Laissez-Faire Leadership
| Variable | 1) | 2) | 3) | 4) | 5) | 6) | 7) |
| 1) Gender | 1.00 | .09 | -.06 | .04 | .11 | -.09 | -.01 |
| 2) Ethnicity | .09 | 1.00 | -.05 | -.03 | .02 | .06 | .07 |
| 3) Single/multiple teacher departments | -.06 | -.05 | 1.00 | .07 | .02 | .06 | -.09 |
| 4) Workshops | .04 | -.03 | .07 | 1.00 | .26 | .09 | -.02 |
| 5) Online training | .11 | .02 | .02 | .26 | 1.00 | .09 | .10 |
| 6) Trained team that has competed with LDE or CDE team in past four years |
-.09 |
.06 |
.06 |
.09 |
.09 |
1.00 |
.03 |
| 7) Laissez-Faire Leadership | -.01 | .07 | -.09 | -.02 | .10 | .03 | 1.00 |
*Correlations are significant at the 0.05 level (2-tailed)
Spearman correlations were conducted to understand the relationship between ordinal variables and laissez-faire leadership scores. The ordinal variables of interest were highest educational degree earned and training/education in leadership. Results of the Spearman correlations indicated a significant inverse relationship (rs=0-.23, p=0.03) between leadership training or education and laissez-faire leadership. Results of the Spearman correlations between ordinal variables and laissez-faire leadership are presented in Table 12.
Table 12
Spearman Correlations Matrix between Ordinal Variables and Laissez-Faire Leadership
| Variable | 1) | 2) | 3) |
| 1) Highest degree earned | 1.00 | .15 | -.08 |
| 2) Leadership training or education | .15 | 1.00 | -.23* |
| 3) Laissez-Faire leadership | -.08 | -.23* | 1.00 |
*Correlations are significant at the .05 level (2-tailed)
Summary of the Results. From the demographic and leadership training information collected in this study, it was found that 93.5% received leadership training from college courses, 95.3% at workshops, and 57.9% from online training. All participants mentioned receiving leadership training in various amounts and all individuals had earned a college degree at, minimally, the Bachelor of Science level.
The results of the Pearson and Spearman correlations indicated that there were significant correlations between many of the demographic variables. However, only two significant correlations were evident between demographics and leadership styles. The highest degree earned was negatively correlated with transactional leadership, and the amount of leadership training was negatively correlated with laissez-faire leadership style. These results are discussed in the scope of the existing body of knowledge in subsequent sections.
Conclusions
The predominant leadership style of FFA advisors from successful FFA programs was the transformational leadership style (M=3.15, SD=0.43), as opposed to transactional leadership (M=2.45, SD=0.49), and laissez-faire (M=0.86, and SD=0.55). This data supports similar findings from a study conducted by (Greiman et al, 2007), and further illustrates that the majority of FFA advisors of successful chapters (as defined for this study) predominately exhibit transformational styles of leadership. These results show that in the Agriculture, Food, and Natural Resources teaching profession, an individual who stimulates and encourages creativity, provides a role model for high ethical behavior, and instills level of pride in their students, is needed. The instructor who articulate a vision that is inspiring, communicates optimism about future goals, provides a meaning for the task at hand, and gives individual consideration to the student’s needs in the area of self-development will be more likely to build a successful FFA program. This study does not imply that an individual who has a transactional or laissez-faire leadership style will not be able find success as an Agriculture, Food, and Natural Resource teacher; however, a person with a transformational leadership style will be more apt to achieving success when the Golden Horizon Award is used as the basis for defining success. Using transformational leadership as a theoretical base, the fact that participants reported engaging in both transformational and transactional leadership styles at least once in a while supports the notion that leaders should engage in both transformational and transactional leadership behaviors.
In regards to describing current FFA advisors of successful FFA chapters in terms of their leadership training/educational background, the study found an inverse relationship (rs=-0.24, p=0.02) between the highest degree earned and transactional leadership, meaning, as an individual gains more knowledge, they are less likely to employ a transactional leadership style while interacting with their students. This indicates that as an individual earns higher educational degrees they tend to use a more transformational leadership style. Furthermore, this study also discovered an inverse relationship (rs=-0.23, p=0.03) between amount of leadership training received and laissez-faire leadership; most notably, the more leadership training events, seminars, lectures, or classes an individual has attended, the less likely the leader will exhibit a laissez-faire leadership style. These findings are important because it shows that even if an individual has a leadership style that is not serving them as they wish it would, they can find further education and leadership training to help them change their leadership style to something that may better benefit themselves and their programs.
Recommendations
This study found and related research found that the transformational leadership style is the preferred style for FFA advisors as the leader in building successful and ongoing programs for FFA. Further, this particular research limited the determination of success based on different leadership styles of individuals, in particular multi-teacher departments. It is understood that a multi-teacher department may have two or more teachers with differing leadership styles, e.g., one transformational and one laissez-faire, noting that the success of the program may be attributable to one style and the other style may be hampering or stalling the growth and retention of the FFA program. It is suggested that further research be conducted to determine how an individual’s leadership style in a particular FFA program may positively affect the success of that program, or the leadership style of another individual may hinder or stymie the program.
There were no significant differences found between leadership styles and the demographics of those individuals surveyed. The majority of participants surveyed were White/Caucasian (98.1%), males (72.0%), and between the ages of 27 and 67 (M=42.71; SD=9.28). Additional research on a larger scale, inclusive of a more diverse population, should be conducted.
This was a census study of current FFA advisors that are leading successful FFA chapters in the State of Texas. Additional research must be conducted to include all FFA advisors to determine if a single leadership style is prevalent across the FFA organization as whole, and what needs to be done to find or shape individuals that are best suited to lead these programs wherein FFA advisors may better serve today’s youth.
References
Avolio, B. J. & Bass, B. M. (2004). Multifactor leadership Questionaire: Third edition manual and sampler set. Redwood City, CA: Mindgarden
Bass, B. M., & Avolio, B. J. (2000). Technical report, leader form, rater form, and scoring key for MLQ Form 5x- short. Binghamton, NY: Center for Leadership Studies, Binghamton University.
Bass, B. M. (1985). Leadership and performance beyond expectations. New York: Free Press.
Bass, B. M. (1997). Does the transactional-transformational leadership paradigm transcend the organization and national boundaries? American Psychologist, 52 (2), 130-139.
Brace, N., Kemp, R., & Snelgar, R. (2012). SPSS for psychologists (5th ed.). New York, NY: Palgrave MacMillan.
Brungadt, C., Greenleaf, J., Brungardt, C., & Arensdorf. (2006), Majoring in leadership: A review of undergraduate leadership degree programs. Journal of Leadership Education, 5(1), 4-25.
Bryman, A. (1992). Charisma and leadership in organizations. London: Sage. Burns, J. M. (1978). Leadership. New York: Harper & Row.
Burris, S., McLaughlin, K. E., McCulloch, A., Brashears, T., & Fraze, S. (2010). A comparison of first and fifth year agriculture teacher on personal teaching efficacy, general teaching efficacy and content efficacy. Journal of Agricultural Education, 51(1), 22-31.
George, D. & Mallery, P. (2010). SPSS for Windows step by step: a simple guide and reference, 18.0 update (11th ed.). Boston, MA: Allyn and Bacon.
Greiman, B. C., Addington, L. S., Larson, T. G., & Olander, K. R. (2007). Preferred leadership style of agriculture education teachers: An expression of epistemological beliefs about youth leadership development. Journal of Agricultural Education, 48 (4), 93-105.
Harms, B. M., & Knobloch, N. A. (2005). Pre-service teachers’ motivation and leadership behaviors related to career choice. Career and Technical Education Research, 30 (2), 101-124.
Hoover, T. S., Scholl, J. F., Dunnigan, A. H., & Mamontova, N. (2007). A historical review of leadership development in the FFA and 4-H. Journal of Agricultural Education, 48(3), 100-110.
Jenkins, C. C., & Kitchel, T. (2009). Identifying quality indicators of SAE and FFA: A Delphi approach. Journal of Agricultural Education, 50(3), 33-42.
Kelly, S. M. A. (2000). The influences of teacher leadership style on students’ affective motivation.
Master’s Thesis University of Toronto, Ottawa, Canada.
Kouzes, J. M., & Posner, B. Z. (2007). The Leadership Challenge (4th ed.). San Francisco, CA: Jossey- Bass.
Linder, J. R., Murphy, T. H., & Briers, G. E. (2001). Handling nonresponse in social science research.
Journal of Agricultural Education, 42 (4), 43-53.
Lord, R. G., De Vader, C., & Alliger, G. (1986). A meta-analysis of the relation between personality traits and leadership perceptions: An application of validity generalization procedures. Journal of Applied Psychology, 71, 402-410.
Moore, L.L., & Rudd, R.D. (2006). Leadership styles of current extension leaders. Journal of Agricultural Education, 47, 6-16.
Muenjohn, N., & Armstrong, A. (2008). Evaluating the structural validity of the multifactor leadership questionnaire (MLQ), capturing the leadership factors of transformational-transactional leadership. Journal of Contemporary Management Research, 4 (1), 3-14. doi: 10.7903/cmr.704
Nash, C.S., Sproule, J., & Horton, P. (2011). Excellence in coaching: The art and skill of elite practitioners. Research Quarterly for Exercise and Sport, 82, 299-238.
Northouse, P. G. (2010). Leadership: Theory & Practice (5th ed.). Thousand Oaks, CA: Sage. Pallant, J. (2010). SPSS Survival Manual (4th ed.). New York, NY: McGraw-Hill.
Roberts, G. T., & Dyer, J. E. (2004). Characteristics of effective agriculture teachers. Journal of Agricultural Education, 45(4), 82-95.
Rutherford, T. A., Townsend, C. D., Briers, G.E., Cummings, R. C., & Conrad, C.R. (2002). Leadership self-perceptions of WLC participants. Journal of Agricultural Education, 43(2), 22-33.
Simonsen, J. C., & Birkenholz, R. J. (2010). Leadership courses required in agricultural teacher education programs. Journal of Agricultural Education, 51(3), 114-124.
Tabachnick, B. G. & Fidell, L. S. (2012). Using multivariate statistics (6th ed.). Boston, MA: Pearson. Texasffa.org (2013) Texas FFA Association. [online] Available at: http://www.texasffa.org/[Accessed:
28 Apr 2014].
Tomlinson, H., & Holmes, G. (2000). Assessing leadership potential: Fast track to school leadership.
Journal of Educational Administration, 39 (2), 104-117.
Townsend, C. D. (2002). Leadership education: Fantasy or reality? Journal of Leadership Education,
1(1), 35-40.
Ullrich, D.R., (1997). Agricultural education exemplary program indicator development using a modified Delphi technique with agriculture teachers in Texas. Proceedings of the 48th Annual
American Association for Agricultural Educators Southern Region Research Meeting, Little Rock, Arkansas, February 1-4, 1998.
Author Biographies
Zachary Nowak (zachary.nowak@lcisd.org) is an Agriculture, Food, and Natural Resources teacher at B. F. Terry High School in the Lamar Consolidated Independent School District. He received a M.S. in Agriculture from Sam Houston State University, and a B.S. in Agricultural Leadership from Texas A&M University.
Dwayne Pavelock (agr_dxp@shsu.edu) is a Professor of Agricultural Education at Sam Houston State University. He earned his Ed.D. in Curriculum and Instruction from Texas Tech University, his M.S. and B.S. in Agricultural Education from Sam Houston State University, and is a former high school agriculture teacher.
Douglas (Doug) R. Ullrich (agr_dru@shsu.edu) is a Professor of Agricultural Education at Sam Houston State University. He earned his Ed.D. in Agricultural Education from Oklahoma State University, his M.S. and B.S. in Agricultural Education from Texas A&M University, and is a former high school agriculture teacher.
Lawrence A. (Art) Wolfskill (wolfskill@shsu.edu)is an Associate Professor of Agricultural Business at Sam Houston State University. He earned his Ph.D. in Agricultural Leadership, Education, and Communication, an MBA, and a B.S. in Mechanized Agriculture from Texas A&M University.